

Introduction: The Data-Driven Era of Athletics
For decades, athletic coaching relied heavily on empirical intuition, qualitative observations, and traditional training paradigms passed down through generations. In modern sports science, that subjective approach is obsolete. The contemporary sports performance landscape is dictated by Sports Research and Technology—an era where human movement is quantified, evaluated, and optimized through rigorous academic methodologies and advanced digital analytics.
From evaluating the statistical significance of a periodised strength intervention to leveraging machine learning algorithms for predictive injury risk modeling, sports scientists, coaches, and physical education specialists must achieve fluency in data analytics. Performance management no longer relies on subjective visual appraisal; it demands objective, empirical proof.
1. Research Methods in Sports Science
To distinguish evidence-based interventions from unverified commercial claims, practitioners must master research methodology. Sports science utilizes structured experimental designs to determine whether a given training stimulus or ergogenic aid elicits a true physiological adaptation.
Quantitative vs. Qualitative Research
Quantitative Research
Focuses on objective numerical data, statistical measurements, and controlled experimental parameters. It quantifies physical variables such as barbell velocity (m/s), maximal oxygen uptake (VO2 max in mL/kg/min), peak ground reaction force (GRF), or power output (Watts).
- Primary Question: “What is the exact magnitude of performance change?”
Qualitative Research
Examines subjective experiences, psychological perception, and descriptive narrative data. It analyzes athlete feedback regarding Rate of Perceived Exertion (RPE), competitive anxiety indices, or subjective recovery state.
- Primary Question: “How does the athlete perceive and experience the physical intervention?”
The Randomized Controlled Trial (RCT)
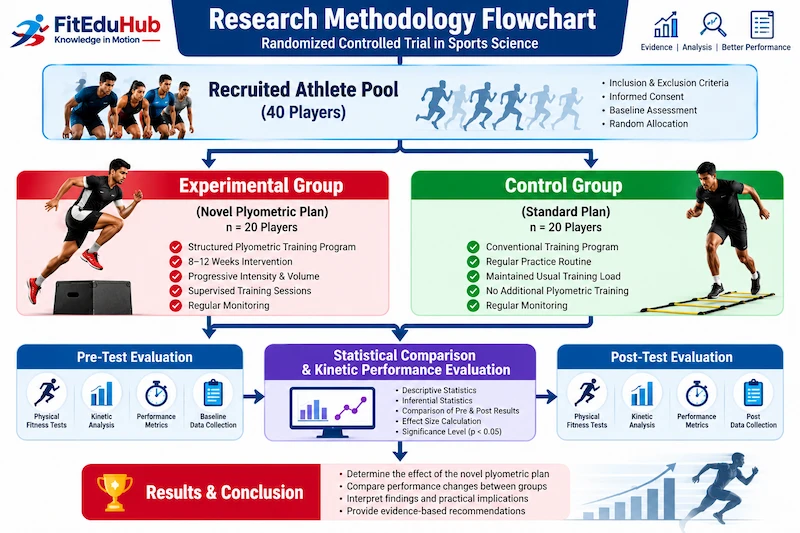
The Randomized Controlled Trial (RCT) represents the gold standard of experimental design in exercise science and clinical sports medicine.
Experimental Protocol
In an 8-week jump performance trial, a sample of 40 homogeneous athletes is randomly allocated into two cohorts:
- Experimental Cohort: Implements a novel accentuation plyometric protocol.
- Control Cohort: Continues standard baseline athletic conditioning.
Scientific Rigour
By controlling for confounding variables (such as nutritional intake, baseline fatigue, and training age), statistical comparison reveals whether vertical jump height gains stem directly from the experimental stimulus rather than biological maturation or normal adaptation.
👉 Pro Tip (Exercise Physiology): Learn how metabolic adaptations, VO2 max kinetics, and energy system strain are evaluated during controlled lab interventions in ourExercise Physiology Guide.
2. Statistics: The Language of Truth
Data collection without statistical validation leads to erroneous conclusions. Practitioners must understand fundamental bio-statistical principles to critically analyze literature in peer-reviewed journals.
Statistical Significance and the P-Value
When evaluating whether an intervention produced a superior outcome, researchers test against the null hypothesis using the p-value (probability value).
p<0.05
A threshold of p<0.05 serves as the universal benchmark for statistical significance in sports performance research. This indicates a <5% probability that the observed performance variance occurred due to random chance, confirming 95% statistical confidence that the training intervention drove the adaptation.
Central Tendency and Variance: Mean vs. Standard Deviation
- Mean (Xˉ): The arithmetic average of a dataset (e.g., a squad’s mean 40-yard sprint duration is 4.80 seconds).
- Standard Deviation (SD): Quantifies the dispersion or variability of data points around the mean score.
σ=N∑(xi−μ)2
- Low SD: The dataset clusters tightly around the mean, indicating high physical consistency across the squad.
- High SD: High variance across the squad, highlighting disparate athletic profiles where some players display elite speed while others require significant conditioning development.
👉 Pro Tip (Strength & Conditioning): Discover how statistical variance in baseline force production guides periodised programming in ourStrength & Conditioning Guide.
3. Evidence-Based Practice (EBP)
Evidence-Based Practice (EBP) is the systematic decision-making framework utilized by elite strength coaches, sports physiotherapists, and high-performance directors. It integrates rigorous research with practical application.
The Three Pillars of Evidence-Based Practice
- Best Available Scientific Evidence: Critical analysis of peer-reviewed literature, systematic reviews, and meta-analyses (e.g., adopting heavy eccentric loading protocols to treat patellar tendinopathy based on clinical trial outcomes).
- Practitioner Expertise & Field Experience: Practical coaching intuition and tactical domain knowledge. While literature may advocate a specific high-volume protocol, an experienced coach adjusts loading parameters when working with adolescent athletes prone to premature burnout.
- Athlete Values, Preferences & Context: Individual psychological readiness, cultural background, and subjective feedback. If a scientifically validated recovery modality causes psychological distress, its physiological benefit is compromised.
4. Wearable Technology: The Lab on the Wrist
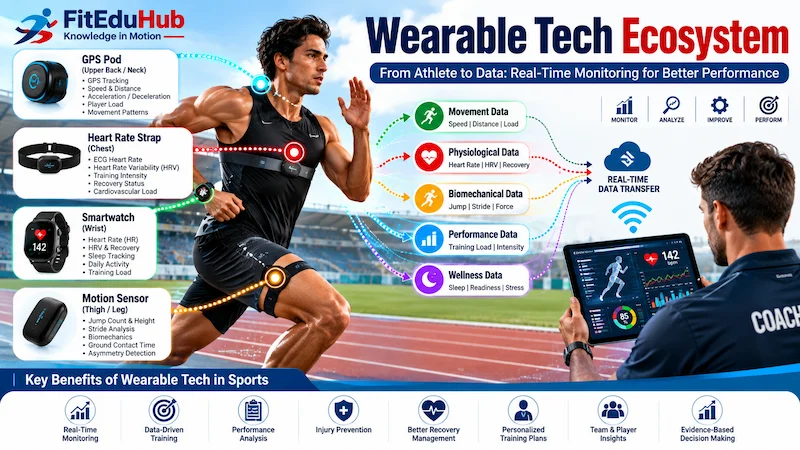
Miniaturized biomedical sensors now allow continuous, real-time physiological profiling directly on the field.
Heart Rate Variability (HRV) Monitoring
Standard heart rate telemetry tracks beat frequency per minute (BPM). Heart Rate Variability (HRV) measures the precise time interval variation between consecutive heartbeats—known as R-R intervals—in milliseconds (ms).
RMSSD=N−11i=1∑N−1(RRi+1−RRi)2
Where RMSSD is the root mean square of successive differences between normal heartbeats.
- High HRV (↑RMSSD): Indicates robust parasympathetic nervous system activity, high autonomic resilience, and systemic recovery. The athlete is prepared for high physiological stress.
- Low HRV (↓RMSSD): Signals sympathetic nervous system dominance, central nervous system (CNS) fatigue, or systemic inflammation.
Applied Micro-Dosing Strategy
If an athlete displays a marked decrease in baseline morning RMSSD, high-performance staff adjust the day’s acute workload—shifting heavy axial strength training to low-intensity restorative mobility.
Tri-Axial Accelerometers and Smart Textiles
Modern athlete monitoring units integrate tri-axial accelerometers, gyroscopes, and magnetometers operating at sampling frequencies up to 1000 Hz.
- Tri-Axial Accelerometry: Measures multidimensional force vectors across three geometric axes: X (side-to-side), Y (anterior-posterior), and Z (vertical).
- External Training Load: Quantifies dynamic impact forces, foot-strike accelerations, and deceleration spikes during change-of-direction (CoD) drills, removing subjective bias from load management.
5. GPS & Athlete Tracking Systems
High-frequency Global Positioning System (GPS) micro-units (10–15 Hz) fitted into specialised anatomical harnesses between the scapulae provide spatial tracking during field-based sports.
Key Metrics in Field Sports Analytics
- Total Distance (m): Quantifies total volume of spatial displacement across a match or training session.
- High-Speed Running (HSR) Distance: Measures distance covered above specific velocity thresholds (typically defined as speeds ≥19.8 km/h). HSR volume is a critical determinant of match intensity and hamstring strain prevention.
- Sprint Distance (≥25.2 km/h): Tracks maximal velocity efforts. Monitoring acute-to-chronic workload ratios (ACWR) for sprint distance mitigates soft-tissue injury risk.
- Positional Spatial Heat Maps: Spatial tracking algorithms aggregate coordinate data to produce visual density distributions, providing objective feedback on tactical execution and structural team positioning.
6. Motion Analysis and Biomechanical Profiling
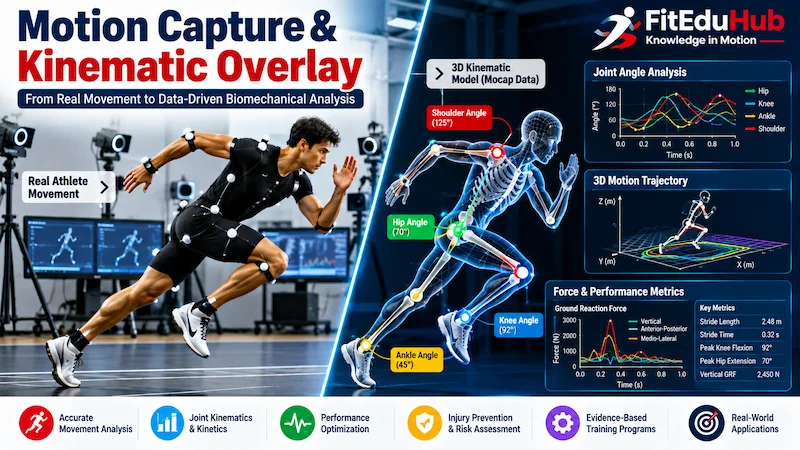
Combining optical camera arrays with kinetic force plates transforms movement analysis into a precise quantitative discipline.
3D Kinematic Motion Analysis
Advanced biomechanics laboratories use multi-camera optical motion capture arrays (e.g., Vicon) to track passive retroreflective markers situated over key anatomical landmarks.
- Anatomical Triangulation: Synchronized infrared cameras record high-speed marker motion across three-dimensional space (X,Y,Z).
- Skeletal Reconstruction: Software transforms raw spatial coordinates into a biomechanical model, calculating joint angles, angular velocities (deg/s), and kinematic chain efficiency.
- Clinical Application: Identifies kinetic flaws, such as excessive dynamic knee valgus or reduced elbow flexion angles during baseball pitching, protecting joints from chronic tissue failure.
Force Plate Kinetics and Ground Reaction Force (GRF)
Force plates utilizing piezoelectric or strain-gauge sensors capture multi-directional Ground Reaction Forces (GRF) at high sampling rates (1000–2000 Hz).
During a Countermovement Jump (CMJ), force plate analysis yields key kinetic markers:
- Rate of Force Development (RFD): ΔTimeΔForce, reflecting neuromuscular explosiveness.
- Asymmetry Index (%): Quantifies bilateral force distribution differences between left and right limbs during takeoff and landing phases.
👉 Pro Tip (Sports Biomechanics): Explore planar mechanics, lever efficiency, and GRF vector manipulation in our comprehensiveSports Biomechanics Guide.
7. Performance Data: The Art of the Dashboard
Collecting vast amounts of physiological and kinematic data creates an information management challenge. Performance staff must distill complex multi-variable datasets into intuitive, operational visual interfaces.
Below is an interactive, responsive HTML/CSS UI component representing a modern Executive Performance Analytics Dashboard:
⚡ Squad Performance & Load Dashboard
Live Telemetry System8. AI in Sports: Predictive Modeling & Computer Vision
Artificial Intelligence ($\text{AI}$) and Machine Learning ($\text{ML}$) algorithms extend analytics from descriptive reporting to predictive modeling.
Predictive Injury Risk Modeling
By processing long-term historical datasets—including $ACWR$, total high-speed running distance, sleep duration, previous injury history, and daily $HRV$ values—supervised machine learning models identify non-linear injury risk patterns.
$$\text{Probability of Injury } P(Y=1 \vert{} X) = \frac{1}{1 + e^{-(\beta_0 + \beta_1 X_1 + \dots + \beta_k X_k)}}$$
These predictive algorithms flag elevated soft-tissue injury probabilities before structural failure occurs, allowing medical teams to adjust training stress proactively.
Computer Vision in Tactical Performance Analysis
Computer vision algorithms automatically process video footage using deep neural networks to track players without hardware sensors.
- Automated Tagging: Identifies offensive structures, defensive spacing, and shot distributions in real time.
- Kinematic Extraction: Evaluates joint angles directly from standard broadcast footage, democratizing biomechanical profiling.
Below is an interactive vector visualization of the AI Predictive Analytics & Data Streaming Architecture:
Summary of Key Technologies in Modern Sports Science
| Technology Category | Primary Hardware / System | Core Measured Variables | Key Applied Metric |
| Autonomic Telemetry | Optical / R-R Chest Sensors | R-R Heartbeat Intervals (ms) | HRV (RMSSD score) |
| Spatial Tracking | 10–15 Hz GPS Micro-Pods | Coordinate Displacement & Velocity | High-Speed Running (HSR > 19.8 km/h) |
| Kinetic Profiling | Dual 3D Force Plates | Ground Reaction Force (GRF at 1000 Hz) | Rate of Force Development (RFD) |
| Kinematic Profiling | High-Speed Camera Arrays | 3D Spatial Marker Coordinates | Joint Angular Velocities (deg/s) |
| Predictive Analytics | Supervised ML Models | Multi-Stream Longitudinal Datasets | Non-Linear Soft-Tissue Injury Probability |
Conclusion: Bridging Science and Coaching Artistry
Digital technology, bio-statistics, and empirical research frameworks provide unprecedented clarity into human physical performance. However, objective data remains a tool to support—rather than replace—coaching expertise.
An accelerometer cannot evaluate competitive mindset; a GPS tracker cannot measure emotional grit; and an algorithm cannot replace empathetic leadership. The future of sports performance lies in integrating quantitative sports science with practical coaching expertise.
Key Questions & Answers: Sports Research & Technology
Answer: External load refers to the objective physical work performed by an athlete, quantified via technologies like high-frequency GPS, accelerometers, and power meters. Conversely, internal load represents the individual physiological and psychological stress response elicited by that external work, measured through Heart Rate Variability (HRV), Blood Lactate, and Rate of Perceived Exertion (RPE).
Answer: Dual Force Plates measure ground reaction forces (GRF) independently under each foot at high sampling frequencies (≥1000 Hz) during dynamic movements like the Countermovement Jump (CMJ). They enable practitioners to detect subtle bilateral movement asymmetries, altered Rate of Force Development (RFD), and underlying neuromuscular fatigue before actual performance decrements become visible.
Answer: Systematic Reviews and Meta-Analyses sit at the top of the EBP pyramid because they methodically aggregate, critically appraise, and statistically synthesize data across multiple independent Randomized Controlled Trials (RCTs). This rigorous methodology minimizes single-study bias, controls for sampling errors, and provides the highest statistical confidence for clinical and athletic decision-making.
Answer: HRV tracks beat-to-beat time intervals (specifically RMSSD metrics) to evaluate autonomic nervous system balance. High resting HRV values reflect dominant parasympathetic activity and optimal physical readiness, whereas a significant drop in HRV indicates sympathetic dominance, incomplete physiological recovery, or excessive systemic stress.
Answer: LPTs attach to resistance equipment to measure real-time concentric bar velocity (m/s). This allows strength and conditioning coaches to auto-regulate daily training volumes and intensities according to an athlete’s immediate neuromuscular readiness, rather than relying on static 1RM percentages.
Answer: IMUs integrate miniature accelerometers, gyroscopes, and magnetometers to capture multi-axial joint angular velocity and rotational orientation. Unlike laboratory-bound optical motion capture systems, wearable IMUs allow continuous 3D biomechanical monitoring during actual match play and unconstrained training settings.
Answer: ACWR evaluates acute training load (typically a 7-day sum) against chronic training historical capacity (typically a 28-day rolling average). Maintaining an ACWR within an optimal range (generally 0.8–1.3) promotes physical adaptation, whereas rapid workload spikes (ACWR > 1.5) correlate with an increased statistical probability of soft-tissue injury.
Answer: sEMG records the microvolt-level electrical potential generated by active motor units beneath the skin. It enables researchers to quantify muscle activation onset times, evaluate firing sequences, and identify compensatory motor patterns during complex sporting movements.
Answer: Descriptive analytics aggregates historical performance metrics to summarize past outcomes (‘what occurred’), whereas predictive analytics employs advanced machine learning algorithms and multivariate modeling to forecast future performance trajectories and potential injury risks (‘what will likely occur’).
Answer: Metabolic carts measure real-time oxygen uptake (VO2) and carbon dioxide production (VCO2) via breath-by-breath gas analysis. This data calculates maximal aerobic capacity (VO2 max), ventilatory thresholds (VT1 and VT2), and Respiratory Exchange Ratio (RER) to assess fat and carbohydrate oxidation rates across incremental intensities.